One useful baseline, no demonstrated model improvement
We tested predictions for 36 later City-reported widths at 12 surveyed transects. The average of earlier widths from the same season missed by 10.01 ft on average. Adding a single, pre-specified wave adjustment missed by 11.98 ft. Lower is better. These are checks against later observations, not estimates of how much sand stayed on the beach.
This work began at the request of a Capo Beach resident. It is an independent exploratory analysis, not a City or USACE finding, engineering design, or proof of a nourishment effect.
What we found and what is still missing
| Source | Useful record | Current status |
|---|---|---|
| City surveys | 12 profiles; seven citywide surveys, 2022–25; older appendix values | PDF widths extracted; raw profiles and survey coordinates not public; requested from the City on 8 Oct 2026 (awaiting reply) |
| CDIP waves | OC043 / OC131 hourly model output | Height/period usable with QC caveats; direction not cleared for transport |
| NOAA tides | La Jolla observed levels; local San Clemente predictions | Proxy correction, not a local observed gauge |
| Landsat / Sentinel-2 | Public imagery and extracted waterlines | Small pilot only; not validated against City MHW widths |
| Beach cameras | USACE and local cameras | Dated public archive not verified |
| CoSMoS-COAST | Potential future simulator | Not run locally; strategy comparison gated |
The City appendix also lists selected 2014–18 widths. Only 39 of 84 site/date cells contain numbers, and the September 2014, May 2016, and August 2018 entries are LiDAR-derived rather than the same profile-survey method used in the 2022–25 test. They were not pooled into the model setup period.
Coverage, format, access checks, and licensing cautions are in the source index.
Study area and width layer
Blue markers: City survey transects. Select one for seven MHW beach-width measurements (fall 2022–fall 2025) and schematic placement timing.
Location precision: all transect and placement markers are illustrative site locations, not surveyed transect origins or placement footprints. City Fall 2024 report, Figure 1 / Table 1 verifies names and order, but the public table does not provide coordinates. CDIP points are likewise placed by their named vicinity, not model-grid coordinates. NOAA TWC0419 uses published station coordinates. Select a marker for its source.
What this page shows
The City surveys 12 profiles from North Doheny (DB-1850) to Cotton's Point (SC-1605), with the fall 2024 survey shown here run on 17–18 Oct 2024. City survey, PDF pp. 7–11
The width series uses the City Fall 2025 appendix, PDF p. 41. Its retrospective 2022–23 values revise six figures in the original reports; the reasons are not fully established. A reported zero means zero MHW beach width, not missing data. Download the source-linked CSV.
Each transect popup shows seven City-reported mean-high-water (MHW) beach widths. These are widths at individual profiles, not shoreline position or sand volume. Survey variation alone does not establish a nourishment effect or predictive skill.
Station note: local NOAA TWC0419 supplies high/low predictions, not local observed water levels. The City corrected observed water levels from La Jolla 9410230 for its survey; La Jolla is outside this map. CDIP OC043 / OC131 are model output points, not instrument buoys.
Base map © OpenStreetMap contributors when tiles load; the dashed marker-connecting line is a schematic coast guide, not a surveyed shoreline. Marker coordinates other than TWC0419 are approximate presentation aids.
Reported placement timeline
Volumes are reported at different times and cannot be added into a measured total. The county later listed approximately 196,000 cy for 2024 federal central beaches and 40,000 cy for North Beach; the 196,000 cy equals the two federal phases (114,000 + 82,000), not an extra placement. As-built dates, footprints and quantities by location remain unpublished. See the placement caveats above.
Wave data: a usable height record, with a seam caveat
CDIP's OC043 and OC131 are nearshore model-output points, not measured buoys. We checked the hourly hindcast-to-nowcast handoff at 31 March / 1 April 2025 against quality flags and a measured offshore buoy. There was no missing hour, duplicate, or obvious step in monthly wave height. The model/buoy median height ratios shifted by roughly 2%, comparable to another within-product buoy-period difference. But the buoy may itself feed the model, so this does not prove nearshore accuracy. Wave direction remains unsuitable for transport claims without an independent check. The wave candidate below used height and period only.
Wave data courtesy of CDIP: data from CDIP, Scripps Institution of Oceanography.
Satellite pilot: useful imagery, unstable agreement
We extracted Sentinel-2 waterlines with CoastSat, using a proxy tide correction and an exploratory wave-runup correction. Visible waterline overlays at the approximate transects generally follow a wet/dry or swash edge; foam and days-to-weeks separation from the field surveys remain problems. The plotted lines are not surveyed MHW contours.
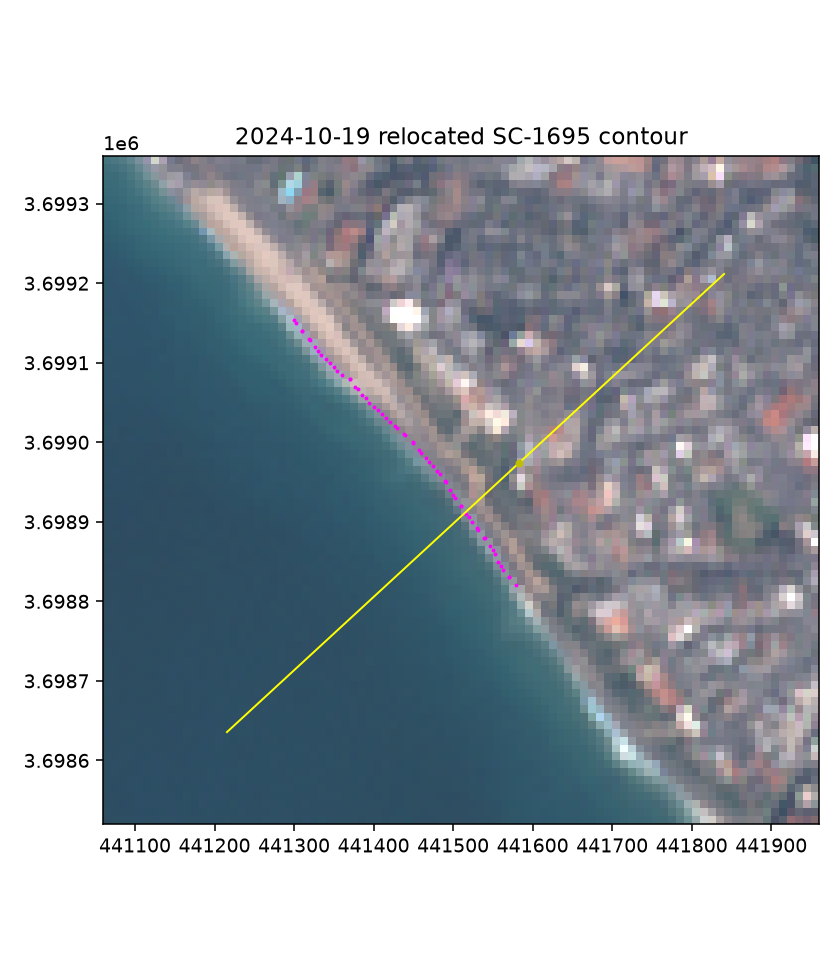
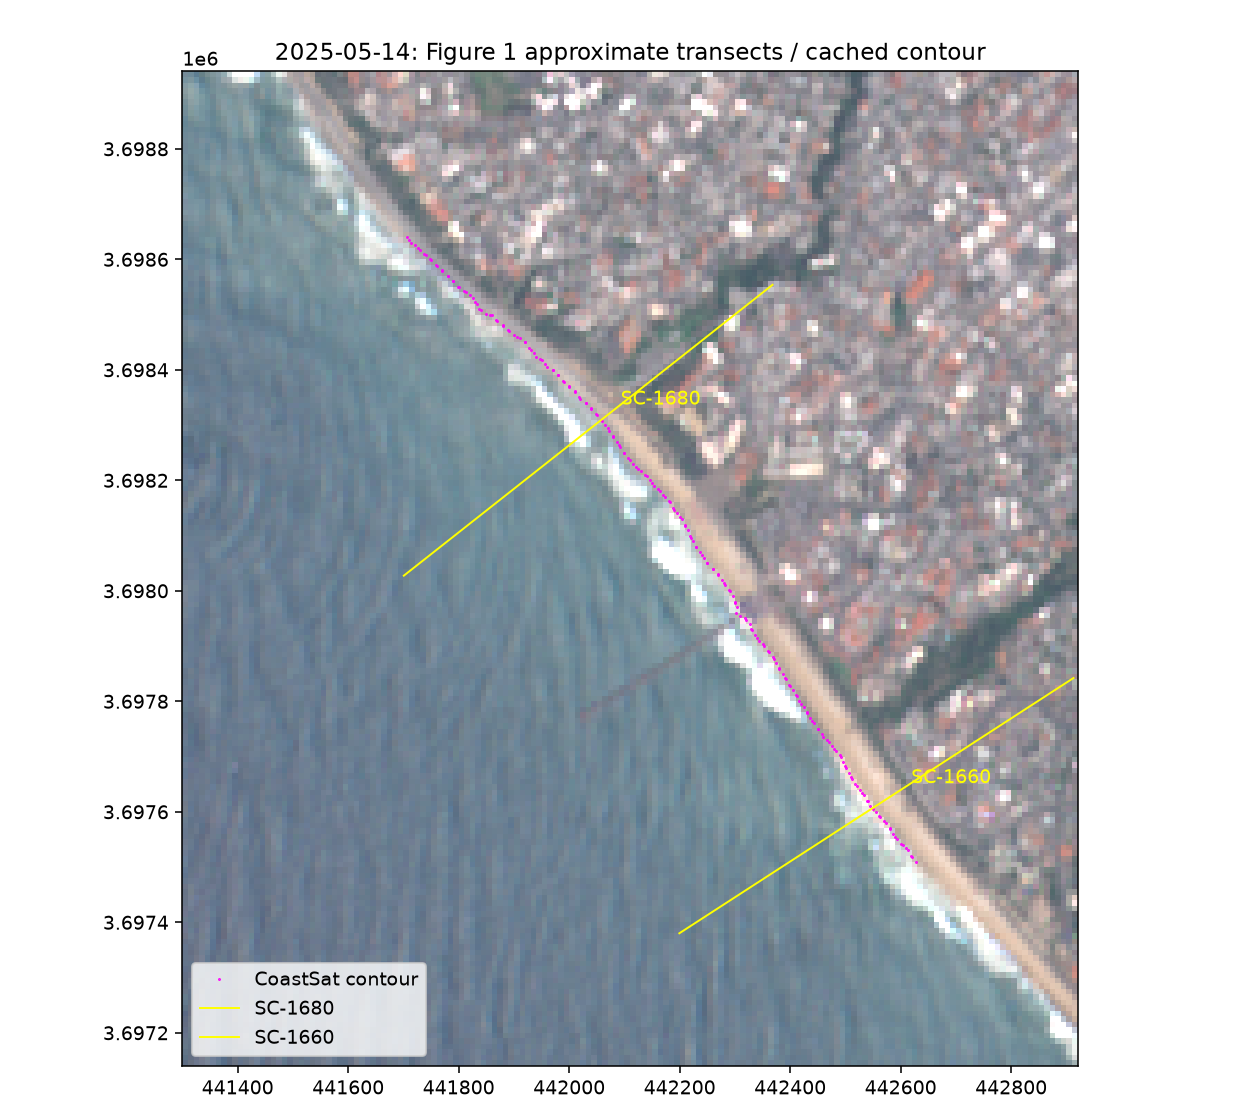
On the fixed 12 previously examined change comparisons, the wave/runup version matched direction in 10/12 and missed by 16.68 ft versus a 32.67-ft no-change comparator. That cleared its stated numerical rule, but the same cases had influenced earlier geometry/window decisions. On six newly evaluable spring-2023 comparisons, direction was only 3/6 and error 46.52 ft versus 30.67 ft for no change. This is a provisional, in-sample diagnostic—not predictive validation or permission to substitute satellite waterlines for City widths. [Fixed diagnostic rows]
Phase 2: predicting later City beach widths
The target was the City's MHW beach width at each transect. We fixed the first four citywide surveys (fall 2022–spring 2024) as the setup period and scored the last three (fall 2024, spring 2025, fall 2025): 12 × 3 = 36 comparisons. Reported zeros remain real zeros. Mean absolute error is the average absolute miss in feet; lower is better. Later survey values had already been seen when the one wave rule was specified, so this is not a blind independent test.
| Rule | Average error | Interpretation |
|---|---|---|
| Earlier same-season average | 10.01 ft | Best baseline |
| Last same-season width | 13.33 ft | Weaker baseline |
| Spring 2024 width for every later survey | 21.94 ft | Weaker baseline |
| Same-season average + 90-day wave anomaly | 11.98 ft | Did not beat the best baseline |
Sources: 36 × 3 baseline predictions, 36 wave predictions, and the Phase 2 method summary.
The single pre-specified wave candidate
The rule added one pooled coefficient for the preceding 90-day, two-point CDIP Hs²Tp anomaly to each transect's same-season average. Its expected sign was negative: rougher waves, narrower beach. We documented and approved that rule before fitting once. Wave-window QC passed 14/14 windows; the coefficient was −4.79. The fall-2024 window was calm (anomaly about −2.0), so the rule predicted widths about 9.7 ft wider than the seasonal mean. Actual fall-2024 widths were close to the plain average. A declared product-seam sensitivity scored 12.14 ft and did not alter the decision. No further candidates will be fitted to these same outcomes.
All 36 later widths
Observed City width and four predictions, in feet. Values rounded to one decimal here; downloads preserve full precision. This table is the check record, not 36 independent weather experiments.
| Survey | Transect | Observed | Season avg. | Last season | Spring '24 | + waves |
|---|---|---|---|---|---|---|
| Fall 2024 | DB-1805 | 124.0 | 104.0 | 116.0 | 110.0 | 113.7 |
| Fall 2024 | DB-1850 | 157.0 | 168.5 | 181.0 | 148.0 | 178.2 |
| Fall 2024 | SC-1605 | 0.0 | 6.0 | 12.0 | 18.0 | 15.7 |
| Fall 2024 | SC-1623 | 127.0 | 142.5 | 137.0 | 102.0 | 152.2 |
| Fall 2024 | SC-1645 | 160.0 | 186.5 | 179.0 | 176.0 | 196.2 |
| Fall 2024 | SC-1660 | 183.0 | 184.0 | 209.0 | 153.0 | 193.7 |
| Fall 2024 | SC-1680 | 111.0 | 110.0 | 124.0 | 49.0 | 119.7 |
| Fall 2024 | SC-1695 | 0.0 | 0.0 | 0.0 | 19.0 | 9.7 |
| Fall 2024 | SC-1700 | 160.0 | 131.5 | 132.0 | 109.0 | 141.2 |
| Fall 2024 | SC-1702 | 138.0 | 138.5 | 143.0 | 107.0 | 148.2 |
| Fall 2024 | SC-1705 | 6.0 | 1.0 | 2.0 | 15.0 | 10.7 |
| Fall 2024 | SC-1720 | 148.0 | 147.5 | 149.0 | 164.0 | 157.2 |
| Fall 2025 | DB-1805 | 97.0 | 104.0 | 116.0 | 110.0 | 104.2 |
| Fall 2025 | DB-1850 | 151.0 | 168.5 | 181.0 | 148.0 | 168.7 |
| Fall 2025 | SC-1605 | 0.0 | 6.0 | 12.0 | 18.0 | 6.2 |
| Fall 2025 | SC-1623 | 157.0 | 142.5 | 137.0 | 102.0 | 142.7 |
| Fall 2025 | SC-1645 | 206.0 | 186.5 | 179.0 | 176.0 | 186.7 |
| Fall 2025 | SC-1660 | 179.0 | 184.0 | 209.0 | 153.0 | 184.2 |
| Fall 2025 | SC-1680 | 110.0 | 110.0 | 124.0 | 49.0 | 110.2 |
| Fall 2025 | SC-1695 | 0.0 | 0.0 | 0.0 | 19.0 | 0.2 |
| Fall 2025 | SC-1700 | 138.0 | 131.5 | 132.0 | 109.0 | 131.7 |
| Fall 2025 | SC-1702 | 143.0 | 138.5 | 143.0 | 107.0 | 138.7 |
| Fall 2025 | SC-1705 | 1.0 | 1.0 | 2.0 | 15.0 | 1.2 |
| Fall 2025 | SC-1720 | 143.0 | 147.5 | 149.0 | 164.0 | 147.7 |
| Spring 2025 | DB-1805 | 117.0 | 109.5 | 110.0 | 110.0 | 108.4 |
| Spring 2025 | DB-1850 | 129.0 | 161.5 | 148.0 | 148.0 | 160.4 |
| Spring 2025 | SC-1605 | 47.0 | 12.0 | 18.0 | 18.0 | 10.9 |
| Spring 2025 | SC-1623 | 107.0 | 107.5 | 102.0 | 102.0 | 106.4 |
| Spring 2025 | SC-1645 | 170.0 | 169.5 | 176.0 | 176.0 | 168.4 |
| Spring 2025 | SC-1660 | 185.0 | 157.0 | 153.0 | 153.0 | 155.9 |
| Spring 2025 | SC-1680 | 74.0 | 56.5 | 49.0 | 49.0 | 55.4 |
| Spring 2025 | SC-1695 | 25.0 | 20.0 | 19.0 | 19.0 | 18.9 |
| Spring 2025 | SC-1700 | 132.0 | 116.0 | 109.0 | 109.0 | 114.9 |
| Spring 2025 | SC-1702 | 105.0 | 111.5 | 107.0 | 107.0 | 110.4 |
| Spring 2025 | SC-1705 | 16.0 | 15.0 | 15.0 | 15.0 | 13.9 |
| Spring 2025 | SC-1720 | 154.0 | 163.5 | 164.0 | 164.0 | 162.4 |
Limits and next steps
What the evidence does not say
- No comparison isolates the effect of the 2024 placements. The setup period may already include federal sand; delivery footprints and dates are incomplete, and there is no clean untreated control.
- City MHW widths and satellite MSL-like waterlines are different measurements. Approximate map transects are not survey geometry; the exploratory beach slope is not a measured local slope.
- The three later survey dates are a small, non-blind check. The seasonal mean is useful here, not a demonstrated physics model or a forecast guarantee.
What happens next
- Requested surveyed transect coordinates and 2022–25 profiles from the City (8 Oct 2026); awaiting reply.
- The 2014 NOAA/USACE DEM was checked at three approximate transects, but the MHW and MSL crossings fall in a data gap. A separate 2016 DEM has observed crossings; neither establishes the City survey geometry. Wait for the requested coordinates and profiles before comparing them with City widths.
- Reconcile federal as-built volumes and timing if records become available.
- Only with genuinely new evidence, revisit satellite geometry and model evaluation. Phase 3 placement-strategy simulations remain on hold until predictive skill is demonstrated.
Methods & audit
This public page presents derived numbers and illustrative overlays; it does not publish raw imagery, key material, survey files, or account details. Working notes and code are not published here; they are available on request for independent review. Primary documents and provider pages are linked in the source index.
- City widths: 84 measurements and source document.
- Prediction checks: baseline rows and wave-candidate rows.
- Satellite diagnostic: fixed comparisons; source imagery and software are described in the source index.
- Placement, wave, tide and elevation references are in the source index. Methods limitations and decisions are summarized above.
Report compiled 8 October 2026. Contains modified Copernicus Sentinel data (2024–2025), processed with CoastSat. All coordinates shown on the map except NOAA's named tide station are illustrative.